
CONTENT
Causes of death across Peru are changing because of Population Increase, Life Expectancy rise and Living Standard.On this below article we provide graphical representation of major causes of death in Peru.
Highlights of Peru BMI and Diet Compositions
Comprehensive data on food supply and consumption is published by the UN Food and Agriculture Organization (FAO). Data was analyzed by The Global Graph and is published in these below Highlights, Graphs and Tables (Data Quality & definitions)
- As per United Nations Food and Agricultural Organization (FAO), average person in Peru gets their caloric supply from :
- Carbohydrates : 91.29%
91.29% - Fat : 21.66%
21.66% - Plant protein : 9.01%
9.01% - Animal protein : 5.09%
5.09% - 27.06% increase in caloric supply : Currently Peru gets 2700/kilocalories per person per day worth of caloric supply when compared to 2125/kilocalories per person per day in Year 1961
- Cereals & Grains, Starchy Roots and Fruits & Vegetables are three major diet compositions in Peru
- Rice, Wheat and Maize are three major Cereal preferences in Peru
- National and World Health Organization (WHO) recommendations on vegetable intake is to range between 200-250g per day and in Peru average intake is 181.23 grams
- Plantains, Oranges & Mandarines and Pineapples are three major Fruit Types Intake in Peru
- National and World Health Organization (WHO) typically set a guideline of 200g Fruit Intake per day and in Peru average Fruit intake is 323.86grams
- In Peru, average male height is in the increasing trend and female height is in increasing trend
- 56.30% of population is suffering from obesity and this trend is continously increasing from last few years
- Average Male BMI in Peru is in the range of obese and Average Female BMI is in range of obese (BMI = Body Mass Index - The WHO define a BMI <=18.5 as 'underweight'; 18.5 to 25 as 'normal/healthy'; 25.0 to 30.0 as 'obese')

| Rank | Cereals | kcal/capita/day |
|---|---|---|
| 1 | Rice | 519 |
| 2 | Wheat | 355 |
| 3 | Maize | 185 |
| 4 | Barley | 35 |
| 5 | Oats | 0 |
| Rank | Type | kilocalories per person per day |
|---|---|---|
| 1 | Cereals & Grains | 1105 |
| 2 | Starchy Roots | 385 |
| 3 | Fruits & Vegetables | 253 |
| 4 | Oils & Fats | 241 |
| 5 | Sugar | 225 |
| 6 | Meat | 141 |
| 7 | Dairy & Eggs | 133 |
| 8 | Pulses | 81 |
| 9 | Alcoholic Beverages | 75 |
| 10 | Other | 61 |
Major Cause of Death
Cancers was a major cause of death in Peru with 25528 registered deaths (in year 2016) i.e. 20% of total deaths. Overall Cancers, Cardiovascular diseases and Lower respiratory infections were the highest types of death causes in Peru.
- We see the maximum number of deaths is seen in age group 70+ with 68740 deaths (year 2016).
- 37.75% kids below age 5 years die because of Neonatal disorders.
- Cancers, Lower respiratory infections and Road accidents are the major cause of death in kids aged 5 - 14 years.
- Cancers, Cardiovascular disease and Road accidents are the major cause of death in people aged 14 - 49 years.
- Cancers, Cardiovascular diseases and Diabetes, blood, and endocrine diseases are the major cause of death in people aged over 50 years.
- Overall, it's observed that 30% of people aging over 50 years die because of Cancers.


Major Risk Factors of Death
- Three Major factors of death in Peru are High blood pressure, High body-mass index (obesity) and High blood sugar. Every year around 308 people die due to High blood pressure.
- Low birth weight and Child wasting are the major risk factor of kids death aging under 5 years.
- Outdoor air pollution and Household air pollution are the major risk factors of death of people aging between 5 to 14 years.
- Alcohol use, High body-mass index (obesity) and High blood pressure are the death risk factors of people aging between 15 to 49 years.
- High body-mass index (obesity), High blood pressure and Alcohol use are the major death risk factors of people aging between 50 to 69 years.
- High blood pressure is the major death risk factors for people aging more than 70 years.

Cancer Analysis
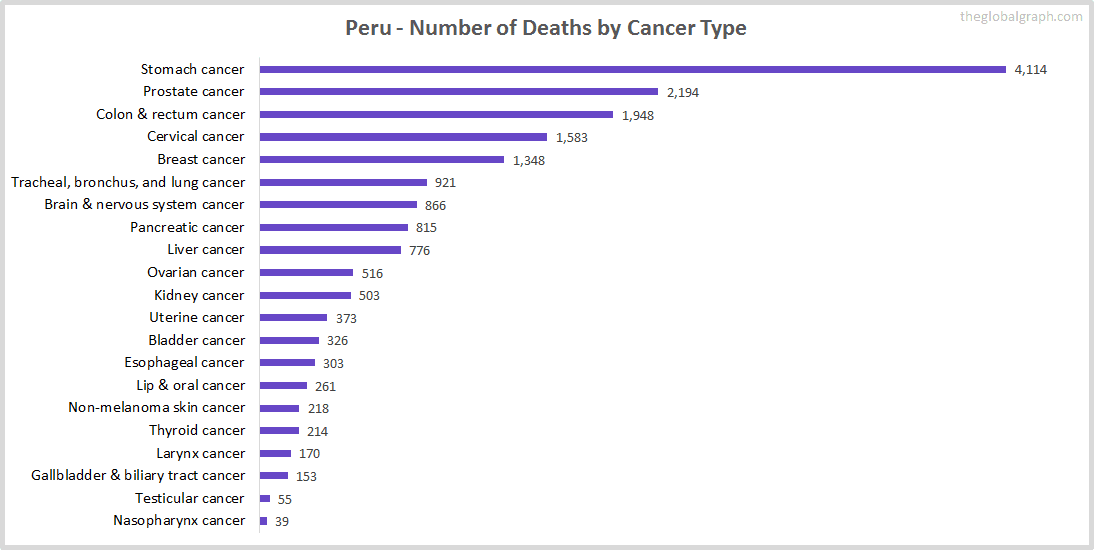
0.37% of Peru population was suffering from cancer i.e. 89449 people (average of years 2011-2016). Highest number of cancer patients deaths were recorded due to Stomach cancer (Count : 4114) and Prostate cancer was also concerning with 2194 deaths in a year. In last few years it has been observed that, people suffering from Esophageal cancer have 7% of survival chance.Peru was really successful in diagnosing Testicular cancer where 94% of people were cured.Highest number of cancer patients i.e. 36636 people were of age group 70+ year olds.In 2016, 6334 were suffering from Stomach cancer out of which 4114 people were dead. This means 64.95% death rate of people suffering from Stomach cancer. This below data represents major cancer types in Peru and number of deaths due to particular cancer types :
- 0.37 % of Peru population is suffering from cancer
- Highest number of deaths were registered due to Stomach cancer
- Testicular cancer was most cured cancer in Peru
- Stomach cancer got lowest survival rate
Tables (Appendix)
| Cause of Death | Number of Deaths | % of Total Deaths |
|---|---|---|
| Dementia | 6205 | 4.9% |
| Cardiovascular diseases | 24974 | 19.72% |
| Kidney disease | 5605 | 4.43% |
| Respiratory disease | 7006 | 5.53% |
| Liver disease | 5230 | 4.13% |
| Diabetes, blood and endocrine disease | 11358 | 8.97% |
| Digestive disease | 3854 | 3.04% |
| Hepatitis | 78 | 0.06% |
| Cancers | 25528 | 20.16% |
| Parkinson's disease | 596 | 0.47% |
| Fire | 358 | 0.28% |
| Malaria | 8 | 0.01% |
| Drowning | 856 | 0.68% |
| Homicide | 1051 | 0.83% |
| HIV/AIDS | 354 | 0.28% |
| Drug disorder | 387 | 0.31% |
| Tuberculosis | 1476 | 1.17% |
| Road incidents | 4196 | 3.31% |
| Maternal deaths | 527 | 0.42% |
| Neonatal deaths | 4395 | 3.47% |
| Alcohol disorder | 279 | 0.22% |
| Natural disasters | 0 | 0% |
| Diarrheal diseases | 830 | 0.66% |
| Road incidents | 4196 | 3.31% |
| Neonatal deaths | 4395 | 3.47% |
| Liver disease | 5230 | 4.13% |
| Kidney disease | 5605 | 4.43% |
| Dementia | 6205 | 4.9% |
| Respiratory disease | 7006 | 5.53% |
| Diabetes, blood and endocrine disease | 11358 | 8.97% |
| Lower respiratory infections | 17572.3954051 | 13.88% |
| Cardiovascular diseases | 24974 | 19.72% |
| Cancers | 25528 | 20.16% |